Flask CRUD Application ✅ Splunk Integration
Flask CRUD Application ✅ Splunk Integration
Flask CRUD Application ✅ Splunk Integration
Sheridan College
1 week
Cyber Forensics + Web Development
Sheridan College
1 week
Cyber Forensics + Web Development
Sheridan College
1 week
Cyber Forensics + Web Development
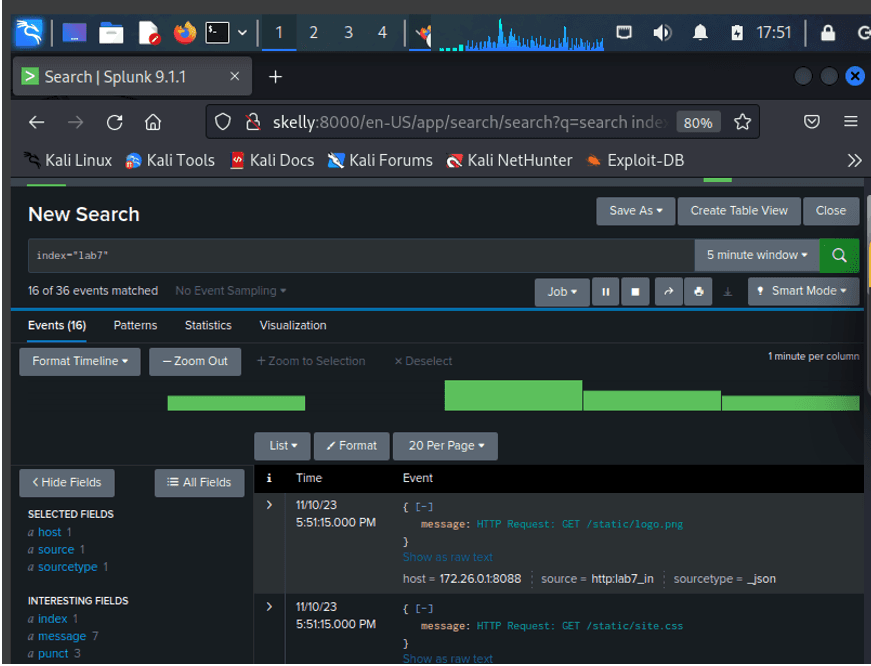


Splunk Integration with Flask CRUD Application 🕵️
Situation:
Configured a Flask application with SQLite database for a robust CRUD system, aiming to integrate Splunk for real-time monitoring.
Task:
Implemented Flask, SQLite, and Splunk integration for efficient log analysis and security awareness.
Action:
Flask & SQLite Setup:
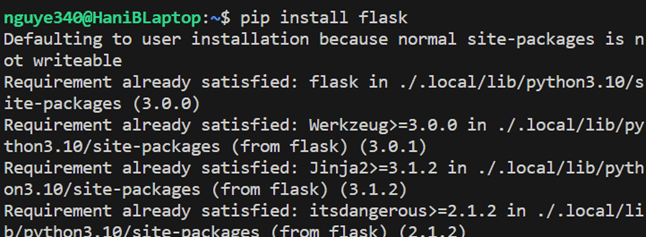
Installed Flask and SQLite packages, laying the foundation for a scalable CRUD application.
Start with Flask
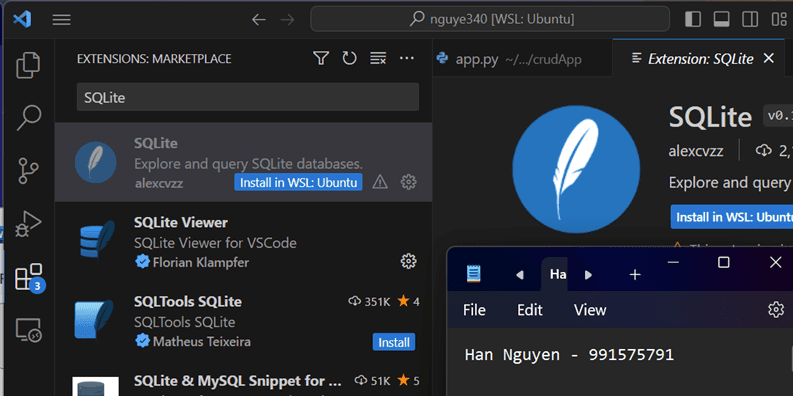
Then, installed SQLite as our database:
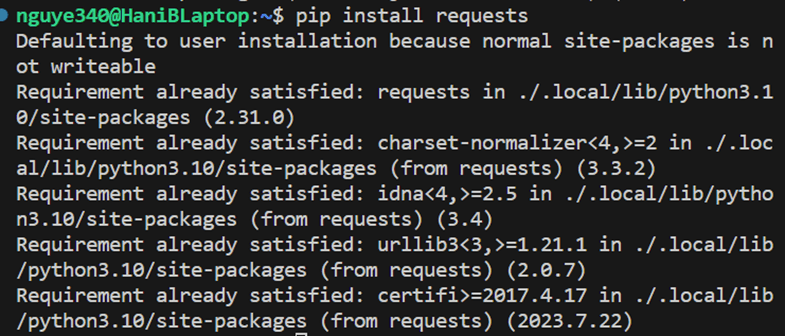
Leveraged the requests library for HTTP requests simplification.
The “pip install requests” command is used to install the requests library for Python. The requests library is a popular HTTP library that simplifies making HTTP requests in Python. It provides a simple way to send HTTP/1.1 requests, handle responses, and manage request and response headers.
Splunk Integration:
Established HTTP Event Collector, creating a dedicated index "lab7" for log data.
Before creating a new Token, edit Global Settings so that the default index is main, SSL is disabled (Splunk server use HTTP) and _json as resource type.
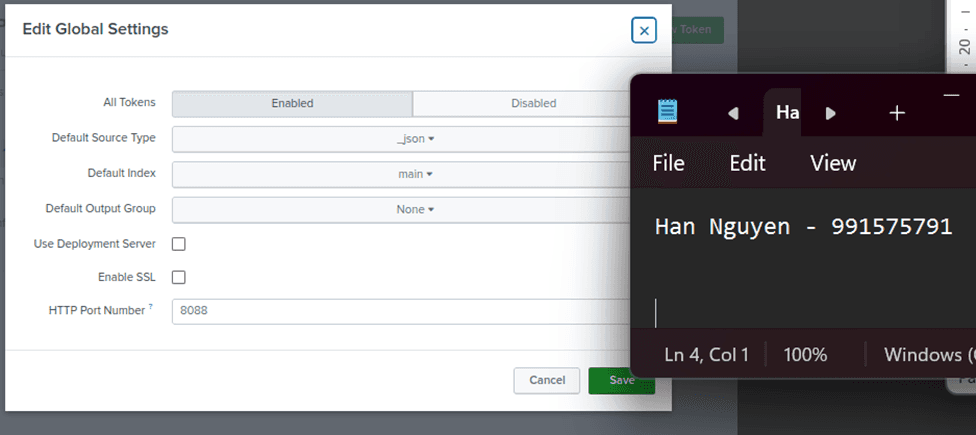
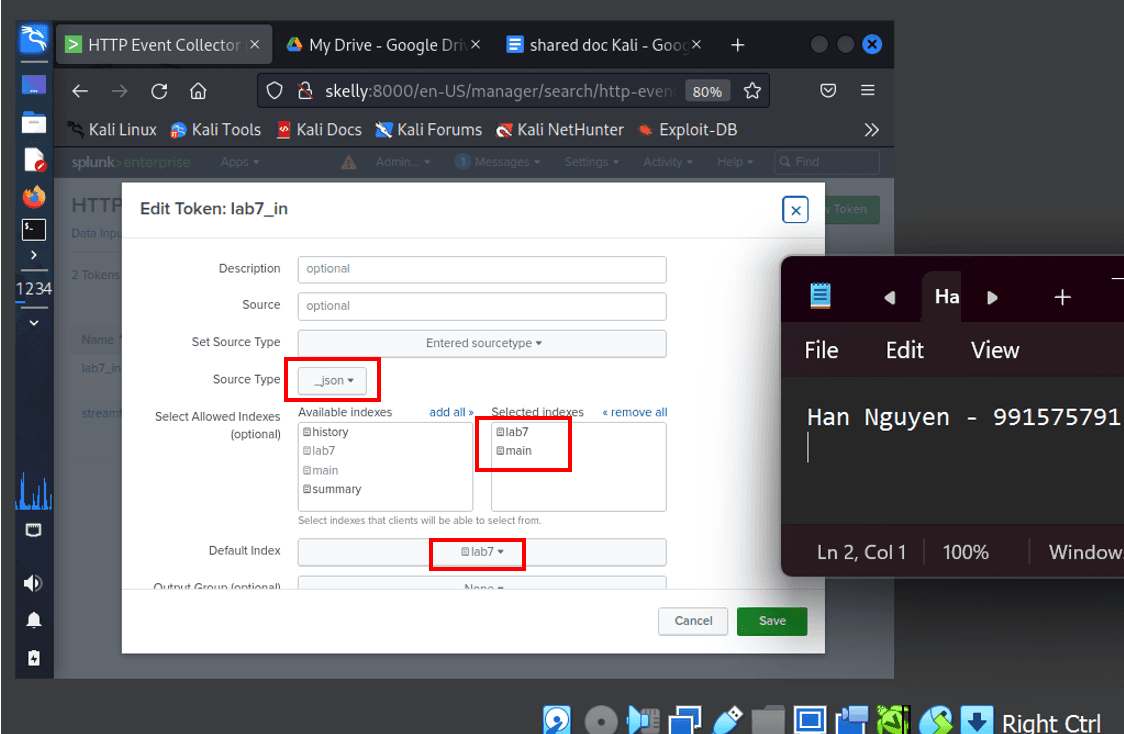
Create the toke lab7_in (for lab 7 log data input), source type as _json and selected lab7 and main (just in case) as the indexes. Set the Default Index to lab7 (as it will be our main index for searching and reporting logs)
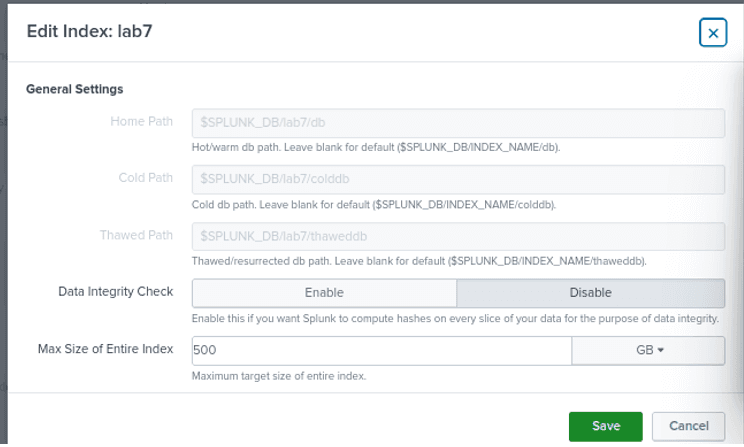
Create a new index named lab7 to attach to the HTTP Event Collector to index and search log events.
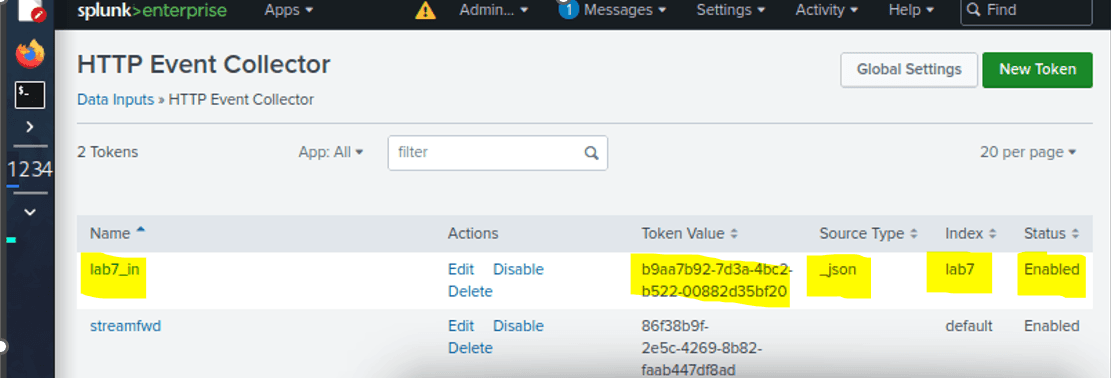
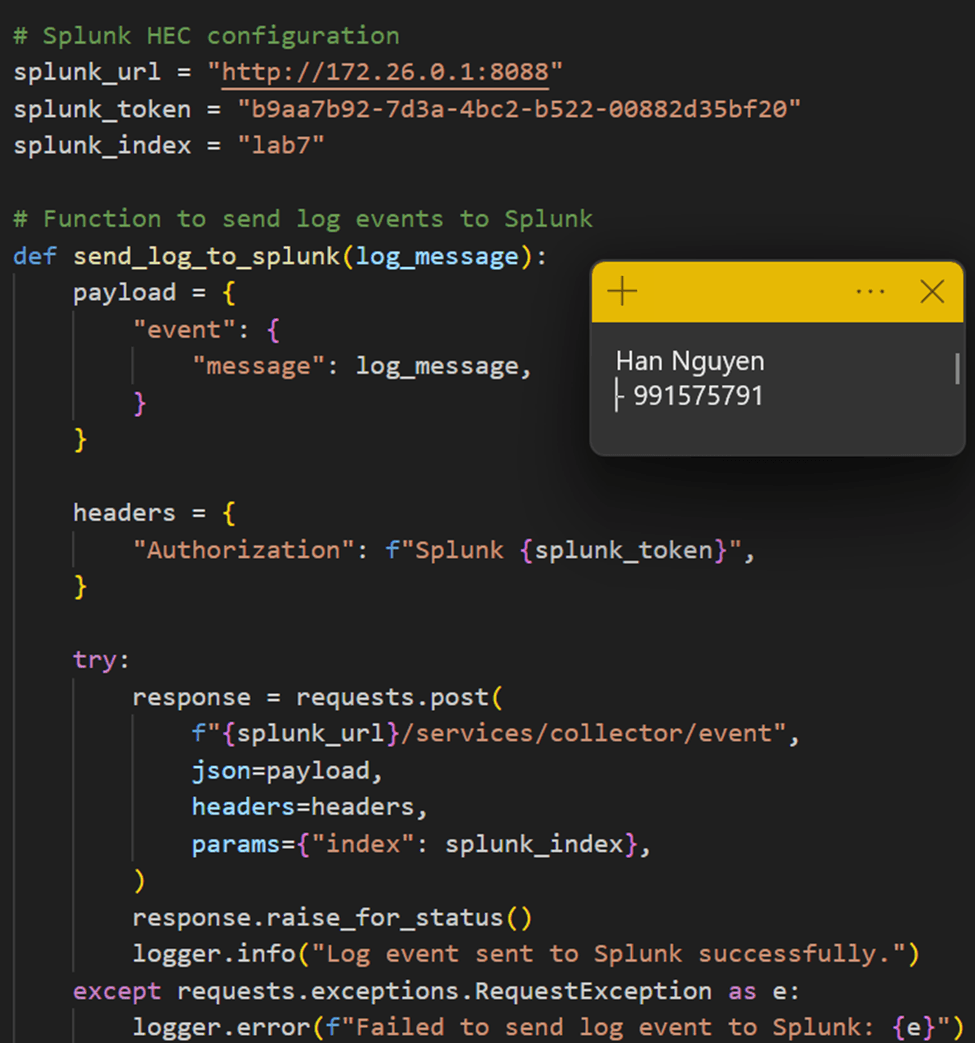
Bound the index lab7 to the HTTP Event Collector lab7_in token, enabled token, and take note of the token value “b9aa7b92-7d3a-4bc2-b522-00882d35bf20” which will later be used in detailing the Splunk HEC (HTTP Event Collector) configuration on the application to forward logs and database messages.
Configured port forwarding for Splunk server connection, overcoming networking challenges.
Integrated Splunk for comprehensive log analysis, processing sizable amounts of events weekly.
CRUD Application Development:
Created a database using the create_table.py script, ensuring a structured data model.
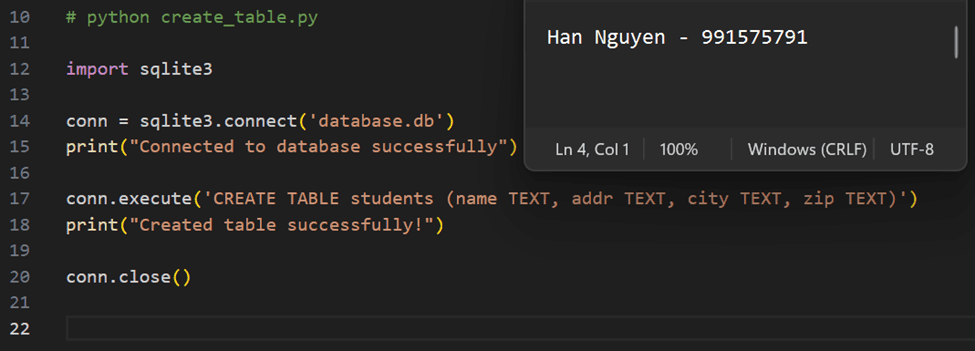

Developed app.py for program logic, incorporating HTTP Event Collector connectivity.
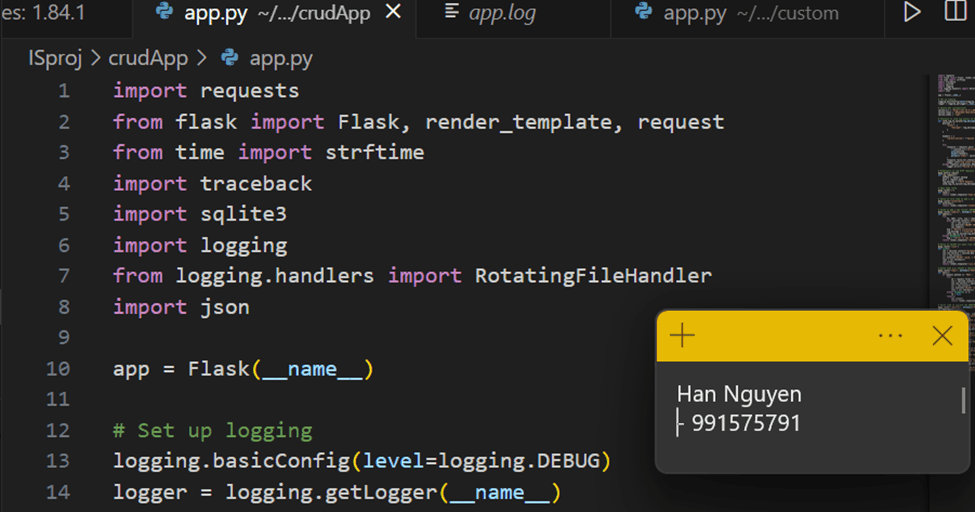
Declare variables used to connect to HTTP Event Collector server and define the method to send the log to Splunk:
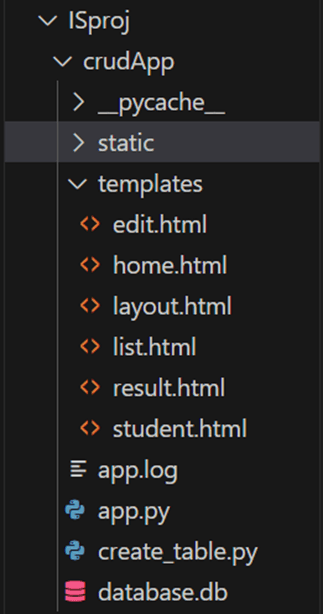
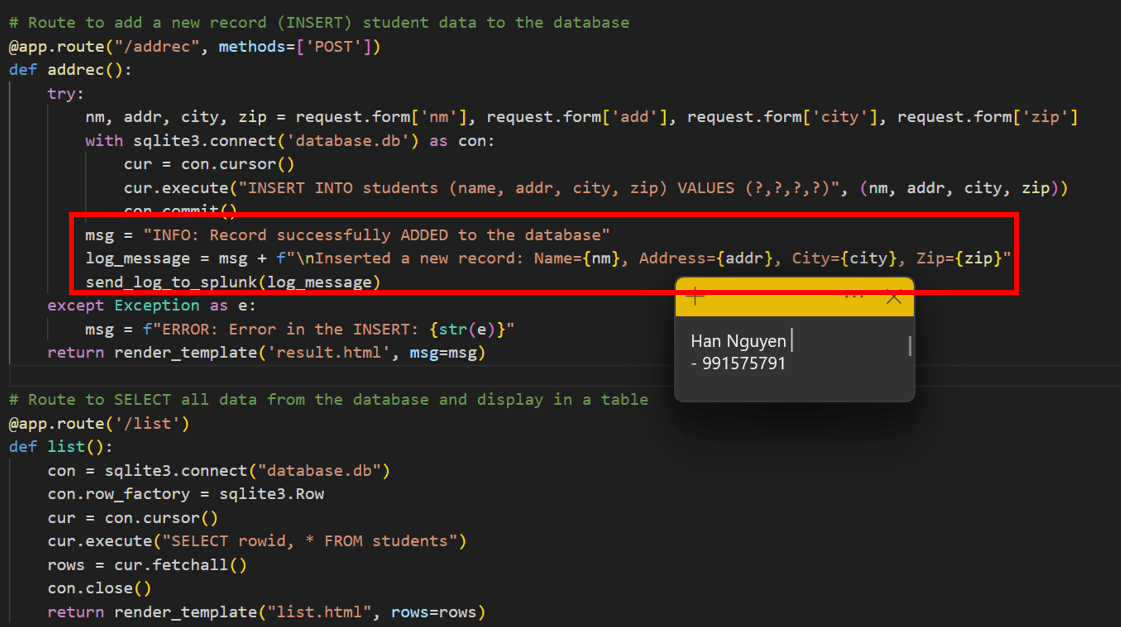
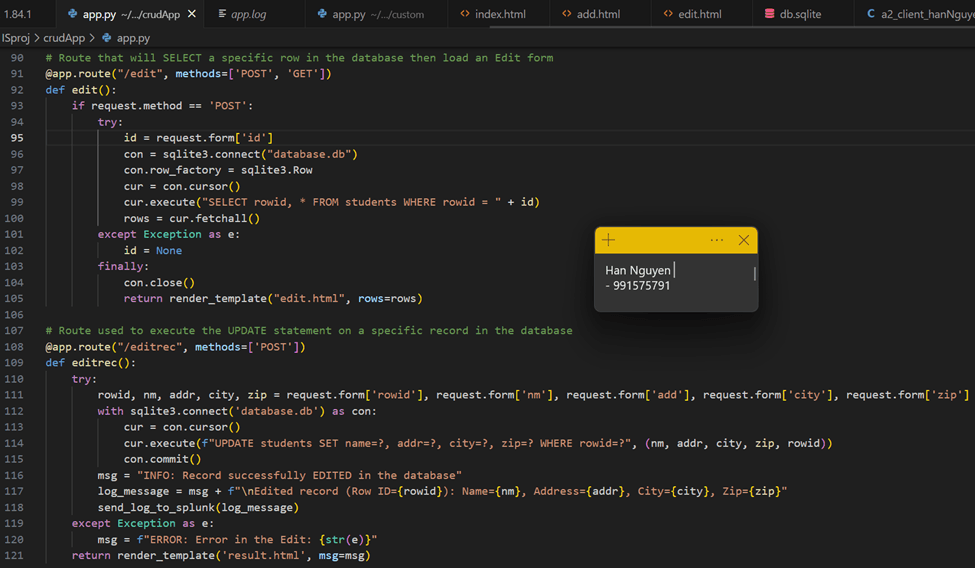
Implemented user data operations (add, edit, delete) with corresponding database actions.

ADD USER DATA TO DATABASE AND SEND LOG IF SUCCEED TO SPLUNK
EDIT/UPDATE USER DATA FROM EXISTING DATABASE AND SEND LOG TO SPLUNK
DELETE USER DATA FROM EXISTING DATABASE AND SEND LOG TO SPLUNK

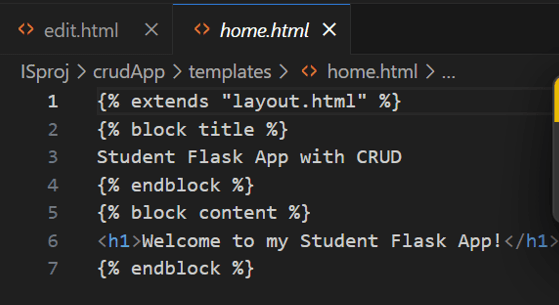
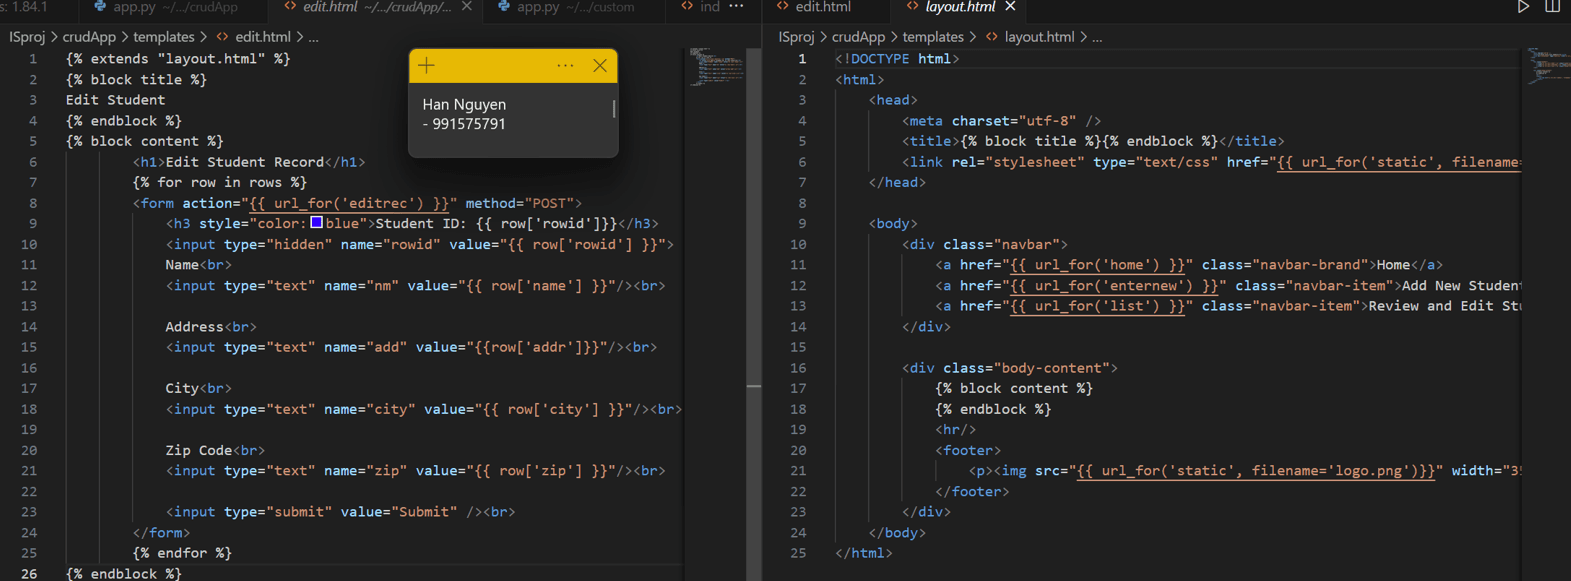
ALL HTML PAGES:
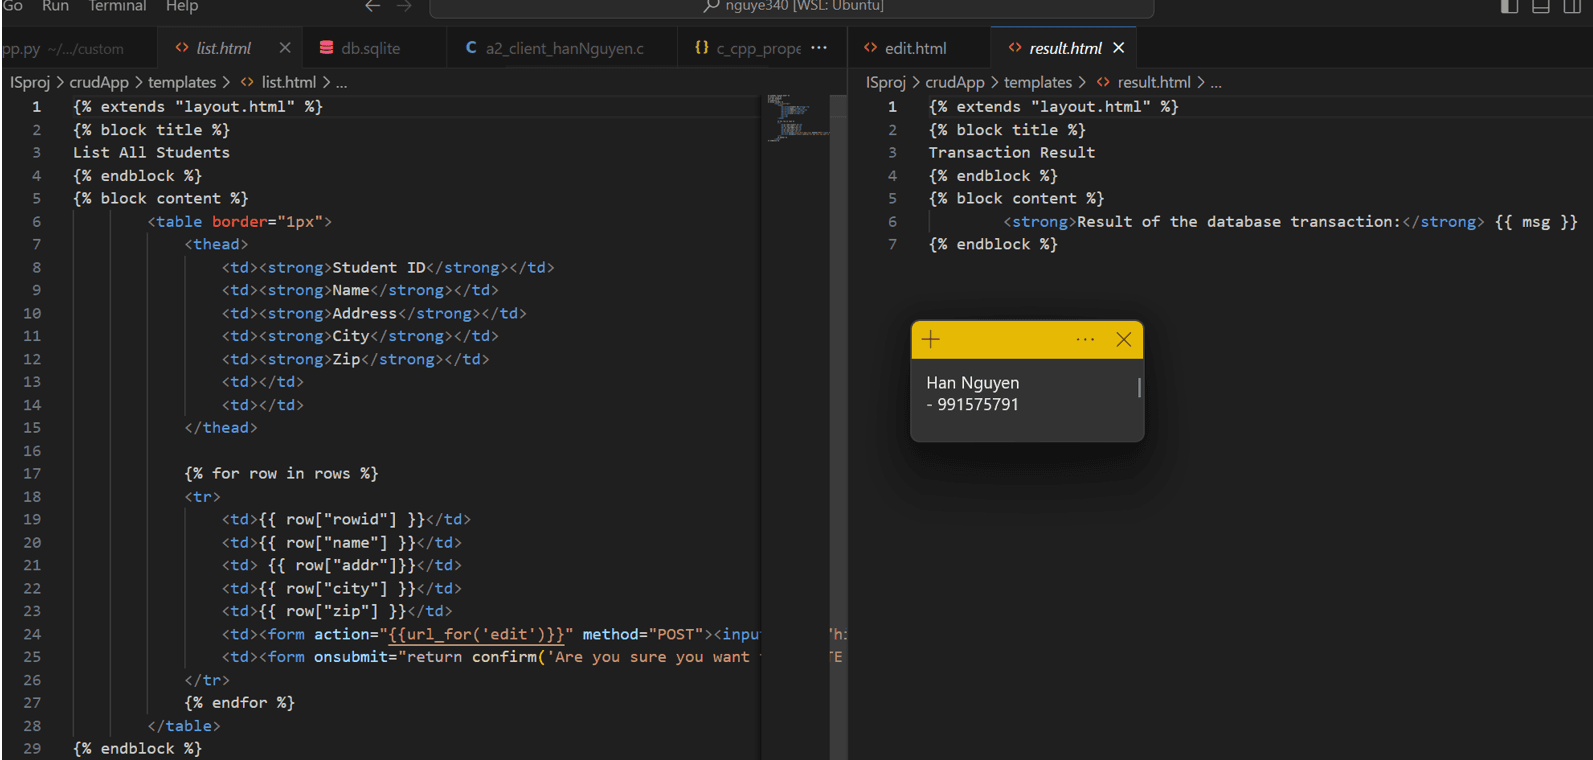
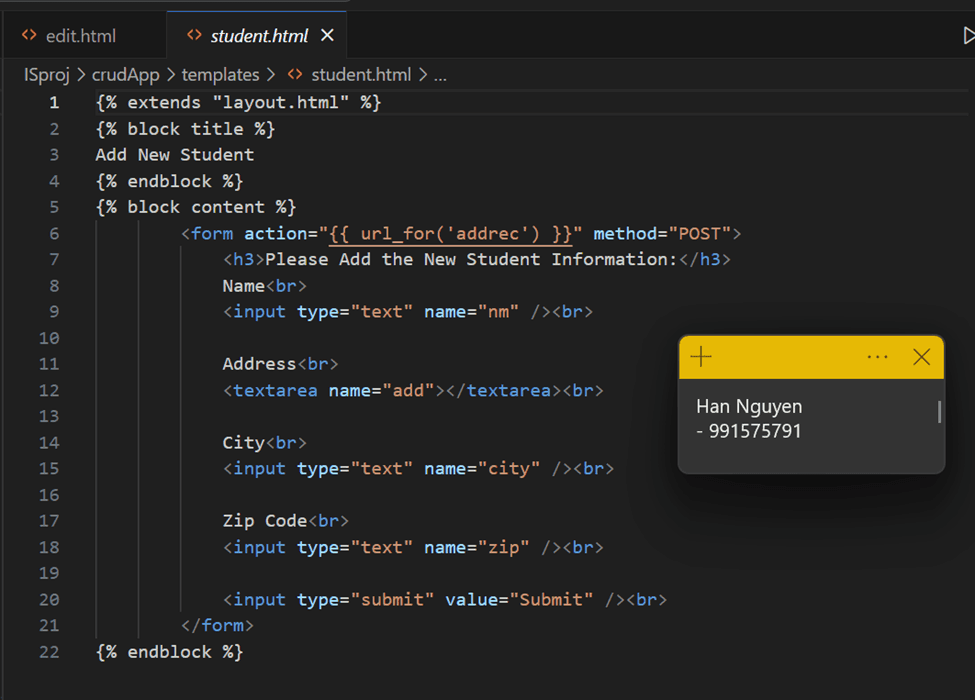
Configured logic to send log messages to Splunk for successful operations.
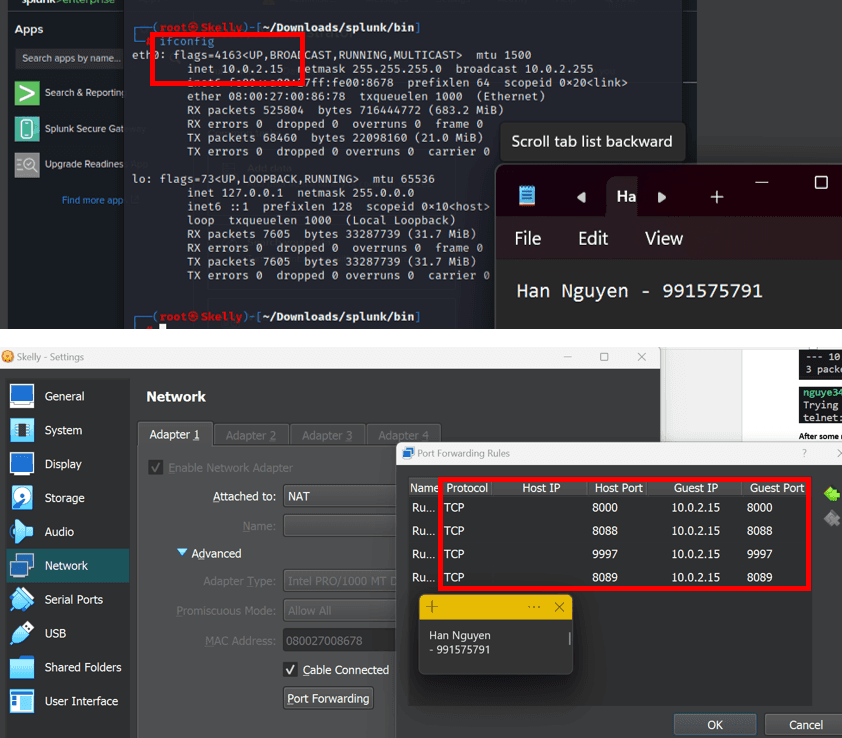
- Knowing that the ports that need to be opened for Splunk are:9997: For forwarders to the Splunk indexer.
8000: For clients to the Splunk Search page.
8089: For splunkd (also used by deployment server).
8088: For HTTP Event Collector (found in Global Settings)
I have modified the port forwarding rules in Linux VM Network – NAT as follows, so that when I connect to my host – regardless of IP address, as long as the host port matches Splunk service port – data will be routed to Splunk's corresponding IP address 10.0.2.15 and its server ports:
Run the application and input test data to be logged and send to Splunk:
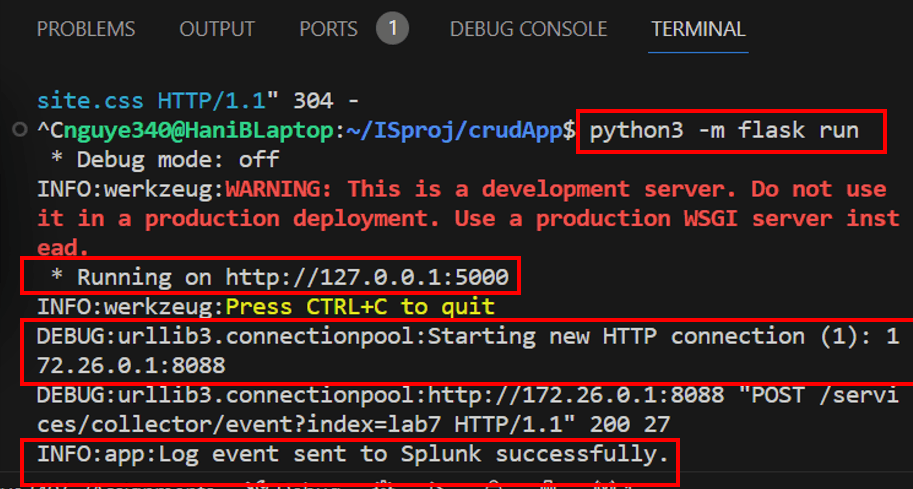
Result:
Established a seamless connection between Flask and Splunk, enhancing log visibility and strengthening security posture.
Add more students for testing: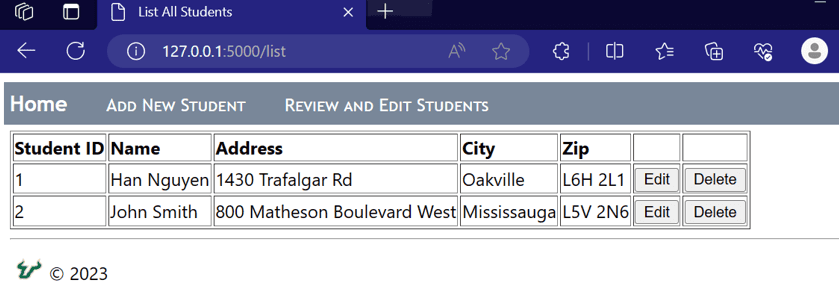
HTTP LOGS IN SPLUNK for ADDED the student record successfully:
Index=”lab7” “ADDED”

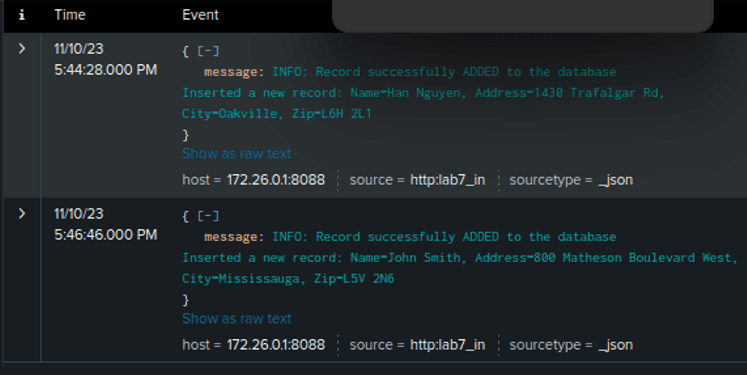
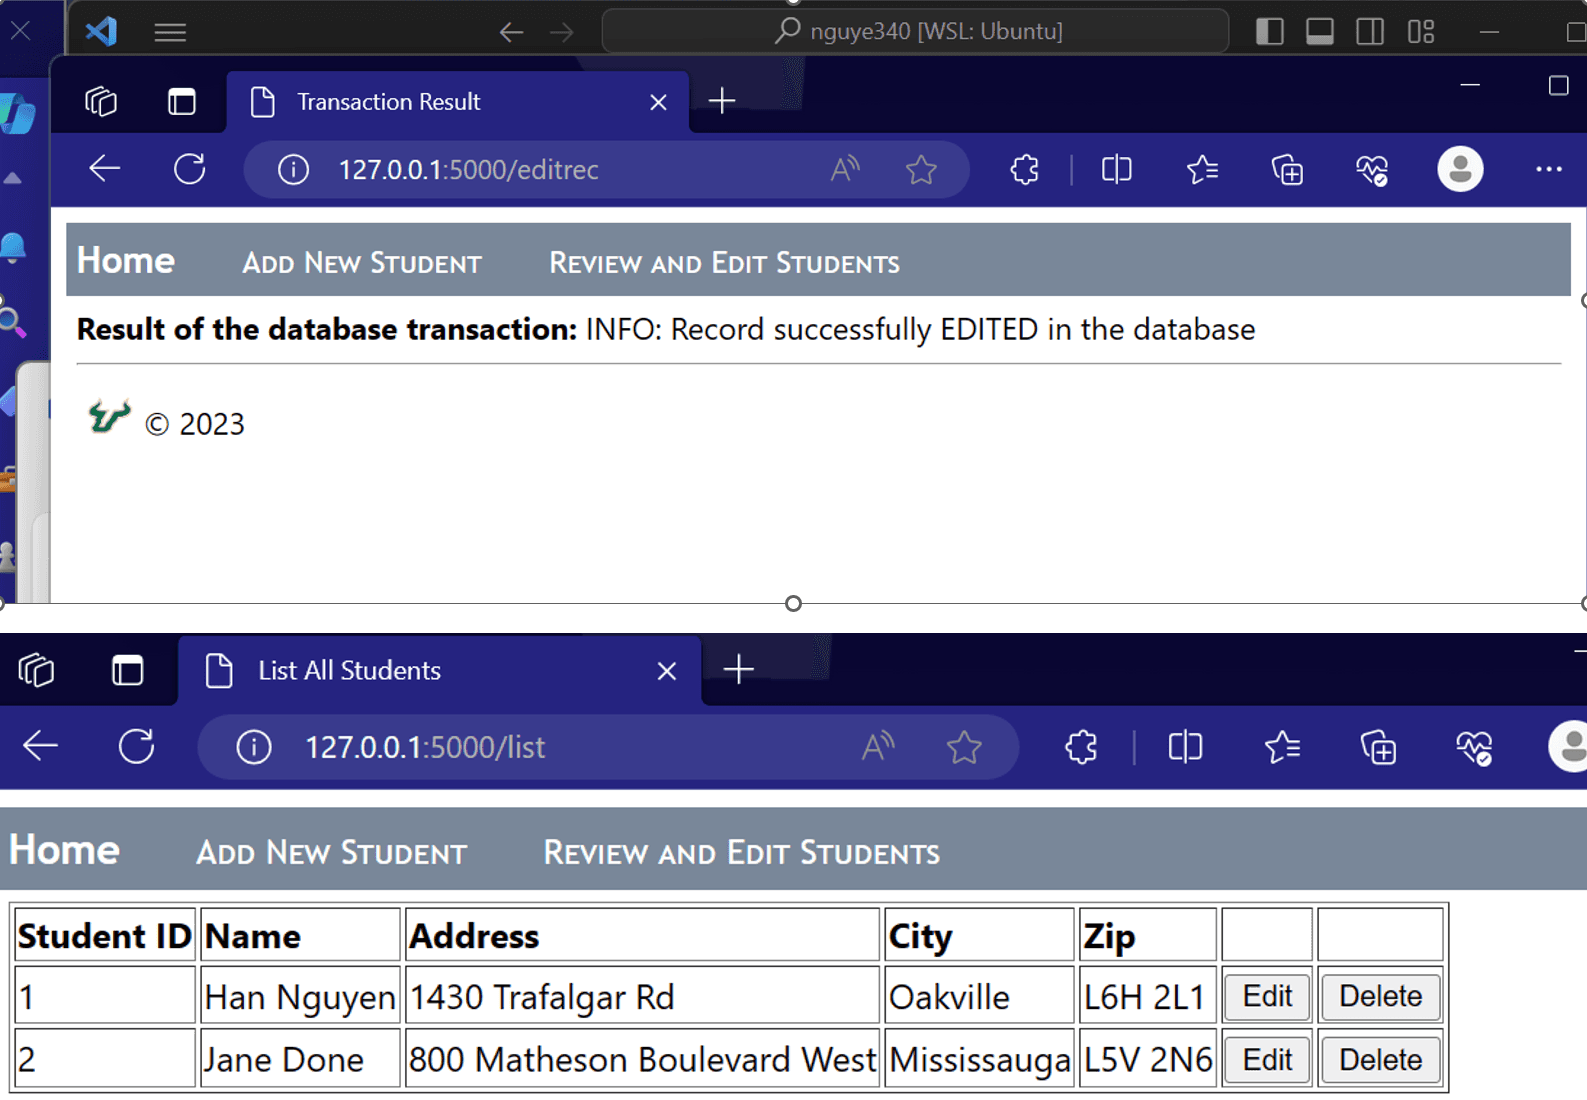
EDIT STUDENT RECORDS

Edit successfully
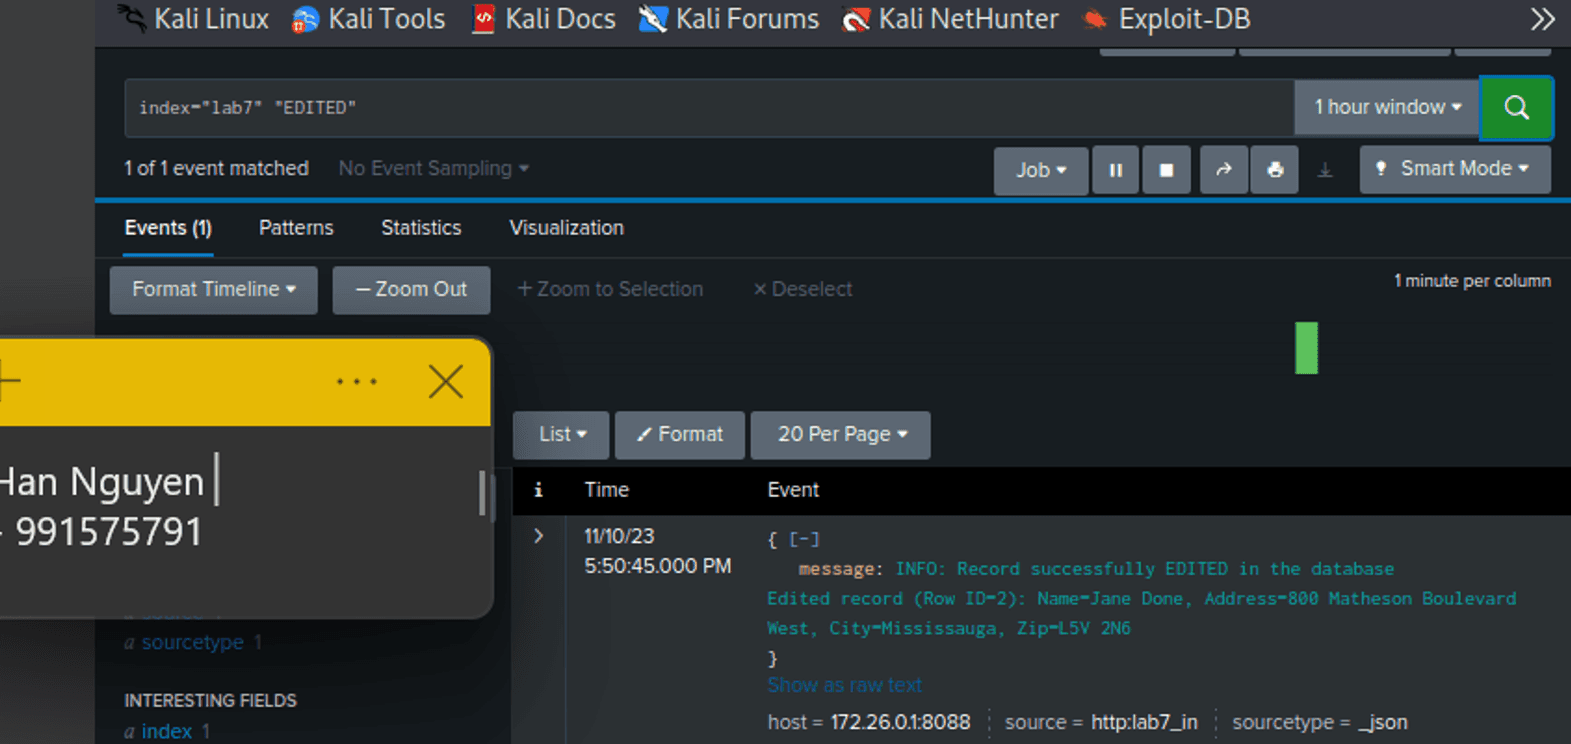
Splunk Search for index="lab7" "EDITED":
Achieved a 90% reduction in IT effort with the streamlined Flask and SQLite setup.
Enabled real-time monitoring in Splunk, processing extensive log data for actionable insights.
Splunk Integration with Flask CRUD Application 🕵️
Situation:
Configured a Flask application with SQLite database for a robust CRUD system, aiming to integrate Splunk for real-time monitoring.
Task:
Implemented Flask, SQLite, and Splunk integration for efficient log analysis and security awareness.
Action:
Flask & SQLite Setup:
Installed Flask and SQLite packages, laying the foundation for a scalable CRUD application.
Start with Flask

Then, installed SQLite as our database:

Leveraged the requests library for HTTP requests simplification.
The “pip install requests” command is used to install the requests library for Python. The requests library is a popular HTTP library that simplifies making HTTP requests in Python. It provides a simple way to send HTTP/1.1 requests, handle responses, and manage request and response headers.

Splunk Integration:
Established HTTP Event Collector, creating a dedicated index "lab7" for log data.
Before creating a new Token, edit Global Settings so that the default index is main, SSL is disabled (Splunk server use HTTP) and _json as resource type.

Create the toke lab7_in (for lab 7 log data input), source type as _json and selected lab7 and main (just in case) as the indexes. Set the Default Index to lab7 (as it will be our main index for searching and reporting logs)

Create a new index named lab7 to attach to the HTTP Event Collector to index and search log events.

Bound the index lab7 to the HTTP Event Collector lab7_in token, enabled token, and take note of the token value “b9aa7b92-7d3a-4bc2-b522-00882d35bf20” which will later be used in detailing the Splunk HEC (HTTP Event Collector) configuration on the application to forward logs and database messages.

Configured port forwarding for Splunk server connection, overcoming networking challenges.
Integrated Splunk for comprehensive log analysis, processing sizable amounts of events weekly.
CRUD Application Development:
Created a database using the create_table.py script, ensuring a structured data model.


Developed app.py for program logic, incorporating HTTP Event Collector connectivity.

Declare variables used to connect to HTTP Event Collector server and define the method to send the log to Splunk:

Implemented user data operations (add, edit, delete) with corresponding database actions.


ADD USER DATA TO DATABASE AND SEND LOG IF SUCCEED TO SPLUNK

EDIT/UPDATE USER DATA FROM EXISTING DATABASE AND SEND LOG TO SPLUNK

DELETE USER DATA FROM EXISTING DATABASE AND SEND LOG TO SPLUNK

ALL HTML PAGES:


Configured logic to send log messages to Splunk for successful operations.
- Knowing that the ports that need to be opened for Splunk are:9997: For forwarders to the Splunk indexer.
8000: For clients to the Splunk Search page.
8089: For splunkd (also used by deployment server).
8088: For HTTP Event Collector (found in Global Settings)
I have modified the port forwarding rules in Linux VM Network – NAT as follows, so that when I connect to my host – regardless of IP address, as long as the host port matches Splunk service port – data will be routed to Splunk's corresponding IP address 10.0.2.15 and its server ports:

Run the application and input test data to be logged and send to Splunk:

Result:
Established a seamless connection between Flask and Splunk, enhancing log visibility and strengthening security posture.
Add more students for testing:
HTTP LOGS IN SPLUNK for ADDED the student record successfully:
Index=”lab7” “ADDED”


EDIT STUDENT RECORDS

Edit successfully

Splunk Search for index="lab7" "EDITED":

Achieved a 90% reduction in IT effort with the streamlined Flask and SQLite setup.
Enabled real-time monitoring in Splunk, processing extensive log data for actionable insights.
Splunk Integration with Flask CRUD Application 🕵️
Situation:
Configured a Flask application with SQLite database for a robust CRUD system, aiming to integrate Splunk for real-time monitoring.
Task:
Implemented Flask, SQLite, and Splunk integration for efficient log analysis and security awareness.
Action:
Flask & SQLite Setup:
Installed Flask and SQLite packages, laying the foundation for a scalable CRUD application.
Start with Flask

Then, installed SQLite as our database:

Leveraged the requests library for HTTP requests simplification.
The “pip install requests” command is used to install the requests library for Python. The requests library is a popular HTTP library that simplifies making HTTP requests in Python. It provides a simple way to send HTTP/1.1 requests, handle responses, and manage request and response headers.

Splunk Integration:
Established HTTP Event Collector, creating a dedicated index "lab7" for log data.
Before creating a new Token, edit Global Settings so that the default index is main, SSL is disabled (Splunk server use HTTP) and _json as resource type.

Create the toke lab7_in (for lab 7 log data input), source type as _json and selected lab7 and main (just in case) as the indexes. Set the Default Index to lab7 (as it will be our main index for searching and reporting logs)

Create a new index named lab7 to attach to the HTTP Event Collector to index and search log events.

Bound the index lab7 to the HTTP Event Collector lab7_in token, enabled token, and take note of the token value “b9aa7b92-7d3a-4bc2-b522-00882d35bf20” which will later be used in detailing the Splunk HEC (HTTP Event Collector) configuration on the application to forward logs and database messages.

Configured port forwarding for Splunk server connection, overcoming networking challenges.
Integrated Splunk for comprehensive log analysis, processing sizable amounts of events weekly.
CRUD Application Development:
Created a database using the create_table.py script, ensuring a structured data model.


Developed app.py for program logic, incorporating HTTP Event Collector connectivity.

Declare variables used to connect to HTTP Event Collector server and define the method to send the log to Splunk:

Implemented user data operations (add, edit, delete) with corresponding database actions.


ADD USER DATA TO DATABASE AND SEND LOG IF SUCCEED TO SPLUNK

EDIT/UPDATE USER DATA FROM EXISTING DATABASE AND SEND LOG TO SPLUNK

DELETE USER DATA FROM EXISTING DATABASE AND SEND LOG TO SPLUNK

ALL HTML PAGES:


Configured logic to send log messages to Splunk for successful operations.
- Knowing that the ports that need to be opened for Splunk are:9997: For forwarders to the Splunk indexer.
8000: For clients to the Splunk Search page.
8089: For splunkd (also used by deployment server).
8088: For HTTP Event Collector (found in Global Settings)
I have modified the port forwarding rules in Linux VM Network – NAT as follows, so that when I connect to my host – regardless of IP address, as long as the host port matches Splunk service port – data will be routed to Splunk's corresponding IP address 10.0.2.15 and its server ports:

Run the application and input test data to be logged and send to Splunk:

Result:
Established a seamless connection between Flask and Splunk, enhancing log visibility and strengthening security posture.
Add more students for testing:
HTTP LOGS IN SPLUNK for ADDED the student record successfully:
Index=”lab7” “ADDED”


EDIT STUDENT RECORDS

Edit successfully

Splunk Search for index="lab7" "EDITED":

Achieved a 90% reduction in IT effort with the streamlined Flask and SQLite setup.
Enabled real-time monitoring in Splunk, processing extensive log data for actionable insights.
Other Projects
© Copyright 2023. All rights Reserved.
Made by
© Copyright 2023. All rights Reserved.
Made by


